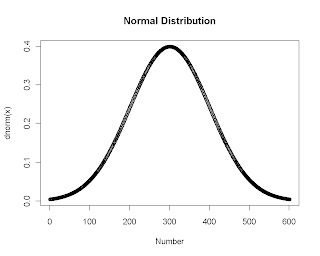
ex: Normal distribution,
dnorm(x, mean = 0, sd = 1, log = FALSE)
pnorm(q, mean = 0, sd = 1, lower.tail = TRUE, log.p = FALSE)
qnorm(p, mean = 0, sd = 1, lower.tail = TRUE, log.p = FALSE)
rnorm(n, mean = 0, sd = 1)
#p <- quantiles, and gives probabilities
pnorm(c(1.645,1.96,3.1))
>[1] 0.9500151 0.9750021 0.9990324
#q <- probabilities, and gives quantiles
qnorm(c(0.95,0.975,0.999))
>[1] 1.644854 1.959964 3.090232
#d <- number, and gives the density
x<-seq(-3,3,0.01)
plot(c(1:length(x)),dnorm(x))
 #r <- generates random deviates
x<-rnorm(1000)
mean(x) # ~0
sd(x) # ~1

沒有留言:
張貼留言